- Home
- Health Topics
- Stats
- Opioid Misuse – Statistics in Haldimand and Norfolk
Opioid Misuse – Statistics in Haldimand and Norfolk
- Opioids were dispensed to 7,245 individuals in Haldimand and Norfolk in 2015 under the Ontario Drug Benefit program. The total rate of opioid users in Haldimand and Norfolk was 12.9% greater than the provincial rate of opioid users; when compared to 49 other regions in Ontario, Haldimand and Norfolk had the 15th highest rate of opioid users.
- Between 2007 and 2016, there was an average of 41 opioid-related ED visits per year in Haldimand and Norfolk.
- The Haldimand and Norfolk crude rate of opioid-related ED visits increased from 17.9 visits to 44.3 visits per 100,000, from 2006 to 2016.
- Between 2007 and 2016, there was an average of 23 opioid-related hospitalizations per year in Haldimand and Norfolk. The crude rates for opioid-related hospitalizations in 2016 were higher in Haldimand and Norfolk compared to Ontario. This difference was statistically significant.
- The Haldimand and Norfolk crude rate of opioid-related hospitalizations increased from 17 visits to 28 visits per 100,000 from 2006 to 2016.
- According to the Office of the Chief Coroner of Ontario, between 2007 and 2016, there was an average of 7 deaths involving opioid toxicity per year in Haldimand and Norfolk.
Opioids Users Covered by the Ontario Drug Benefit (ODB) Program, Haldimand and Norfolk and Ontario, 2015
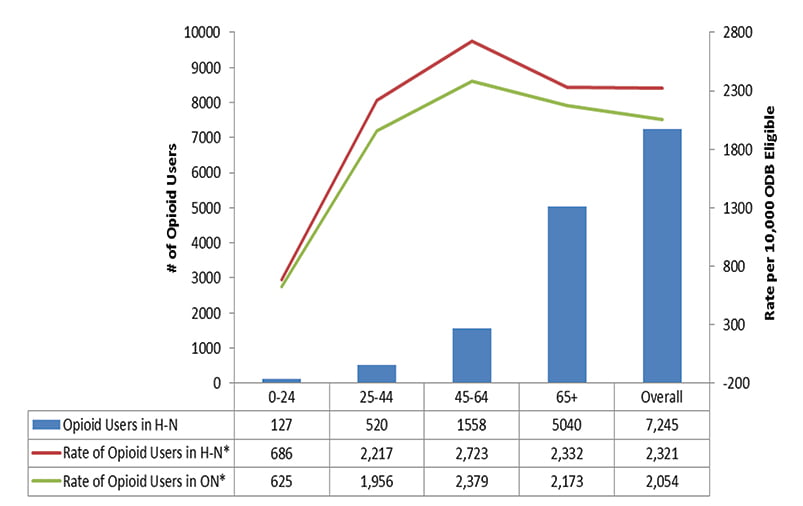
*Rate per 10,000 Ontario Drug Benefit eligible individuals
Source: Ontario Drug Policy Resource Network. Opioid Use and Related Adverse Events in Ontario (November 2016).
The Rate of Opioid-related Emergency Department Visits in Haldimand and Norfolk (H-N) and Ontario (ON), 2003-2016
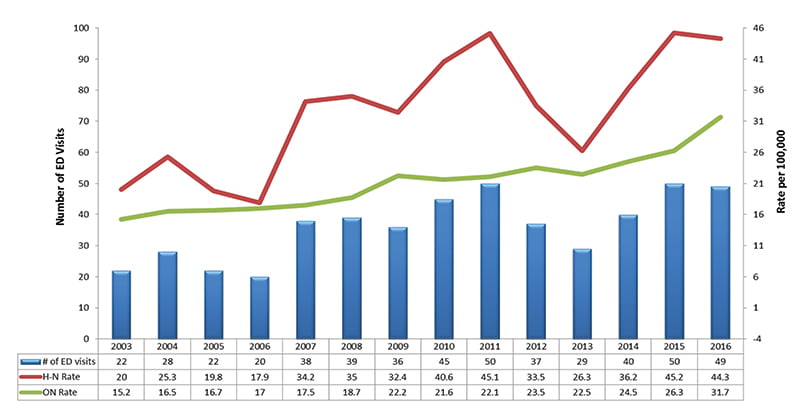
Source: Ontario Agency for Health Protection and Promotion (Public Health Ontario). Interactive Opioid Tool. Toronto, ON: Queen’s Printer for Ontario; 2017. Available from: http://www.publichealthontario.ca/en/DataAndAnalytics/Opioids/Opioids.aspx
The Rate of Opioid-related Hospitalizations in Haldimand and Norfolk (H-N) and Ontario (ON), 2003-2016
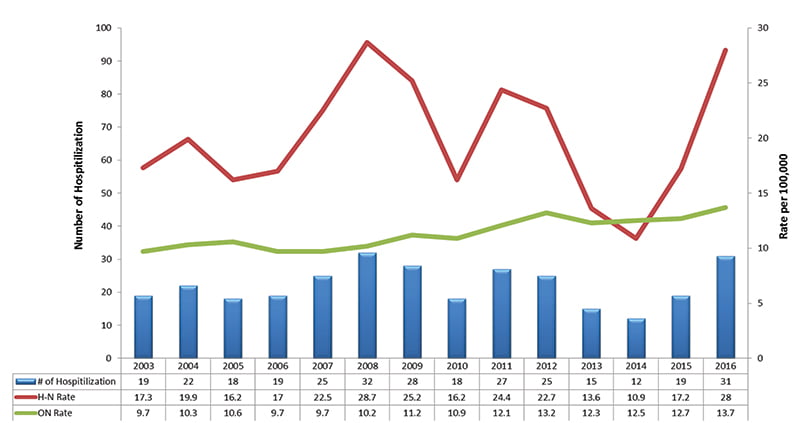
Source: Ontario Agency for Health Protection and Promotion (Public Health Ontario). Interactive Opioid Tool. Toronto, ON: Queen’s Printer for Ontario; 2017. Available from: http://www.publichealthontario.ca/en/DataAndAnalytics/Opioids/Opioids.aspx
The Rate of Opioid-related Deaths in Haldimand and Norfolk (H-N) and Ontario (ON), 2005-2016
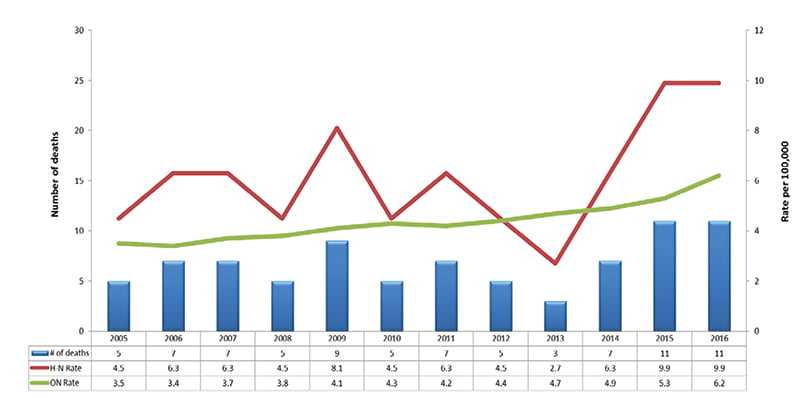
Source: Ontario Agency for Health Protection and Promotion (Public Health Ontario). Interactive Opioid Tool. Toronto, ON: Queen’s Printer for Ontario; 2017. Available from: http://www.publichealthontario.ca/en/DataAndAnalytics/Opioids/Opioids.aspx